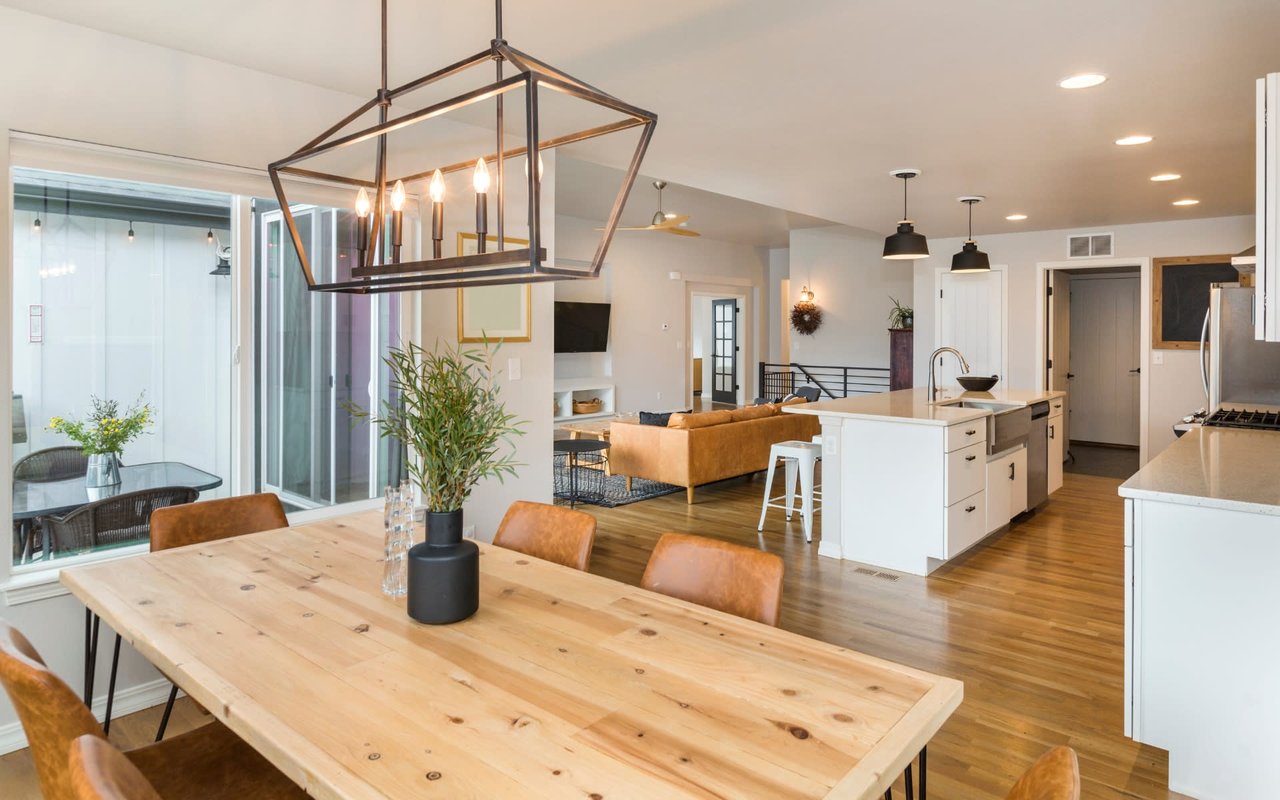
Modern kitchen with a marble island, tan bar stools, and built-in wine racks.

September 2024 Real Estate Market News & More

The Mike Murphy Team November 26, 2024

September is here! Read on for community updates, a great article about the evolving real estate industry landscape, and market news for both San Francisco and Marin County.
 

Local News

Metallic dollar-sign key aimed at a large keyhole on a green wall.
 

So Much About Real-Estate Commissions Just Changed. Here’s What to Know.

The changes come after the National Association of REALTORS® reached a landmark legal settlement earlier this year.
 
READ MORE
 
Collage of an art gallery, dance performance, theater cast, seated men, and women speaking onstage.
 

The Bay Area’s Fall Arts Scene Comes Alive With an Exuberant Lineup of Events

As the leaves turn and the nights get longer, the Bay Area’s vibrant cultural scene beckons with an array of must-see events.
 
READ MORE
 

August 2024 Market Review

Marin County

Stats at a Glance - All Property Types
 
Real estate market statistics: $1.45 million median sale price, $812 per square foot, and 24 days on market.
Real estate market statistics for June through August 2024.
 
August 2024 Data by Area - Single-Family Homes
 
Real estate market statistics table for eight Marin County cities and regions.
 
Seasonality & Long-term Trends
 
# New Listings on Market: All Property Types 2019-2024
 
Orange bar chart of monthly values from August 2019 to August 2024, generally trending lower.
 
Median Sales Price: All Property Types 2014-2024
 
Orange bar chart of dollar values from August 2014 to August 2024.
 

San Francisco

Stats at a Glance: All Property Types
 
June–August 2024 market stats: $1.36M median sales price, $993 per square foot, and 23 days on market.
Real estate market statistics for June through August 2024, including prices, days on market, listings, and sales.
 
Seasonality & Long-term Trends
 
# New Listings on Market: All Property Types 2019-2024
 
Orange monthly bar chart from August 2019 to August 2024, peaking near 1,200 in 2020 and ending below 500.
 
Median Sales Price: All Property Types 2014-2024
 
Monthly dollar-value bar chart from August 2014 to August 2024, rising to a peak around 2022 before fluctuating lower.
 
Note: Above data reflects that reported to NorCal MLS Alliance MLS. Data from sources deemed reliable but may contain errors and is subject to revision. All numbers approximate. Outlier data adjusted when identified.

Work With Us

We have an incredible team and we love getting to know our clients and helping improve their quality of life, so if you want to discuss the complex forces that impact home values, solicit our help in uncovering hidden real estate opportunities, or just grab a coffee and catch up, we’re here.